Desktop GIS for Geoscience

Meridian GIS Your data. Your machine. Your map.

A native desktop GIS built for geoscientists working with subsurface and surface data. Bring in your rasters, vectors, grids, and well data — then explore, analyze, and visualize them, entirely on your own machine. No cloud. No latency. No compromise.
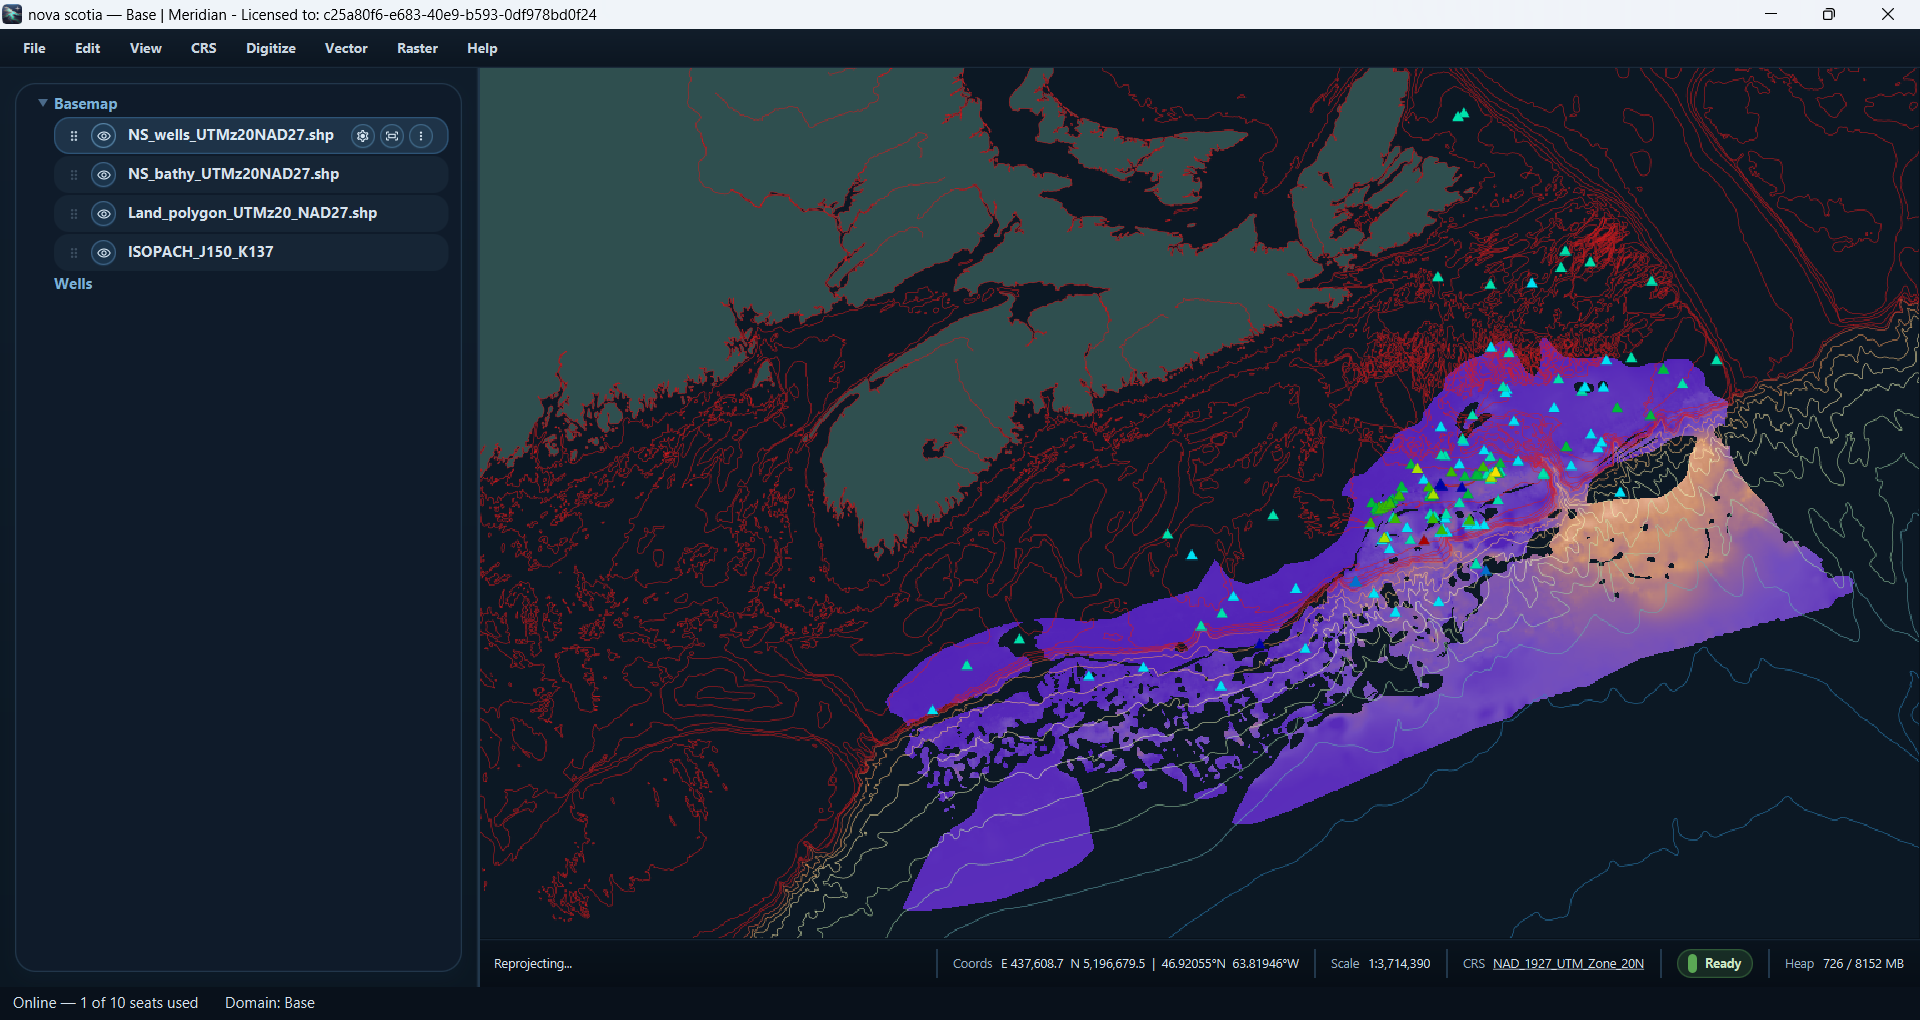
Meridian GIS showing an offshore Nova Scotia basin study: layered shapefiles, bathymetry contours, and a color-mapped isopach grid
Nova Scotia basin study wells · bathymetry · isopach grid
01 Visualize

Grids that look like geology, not spreadsheets.

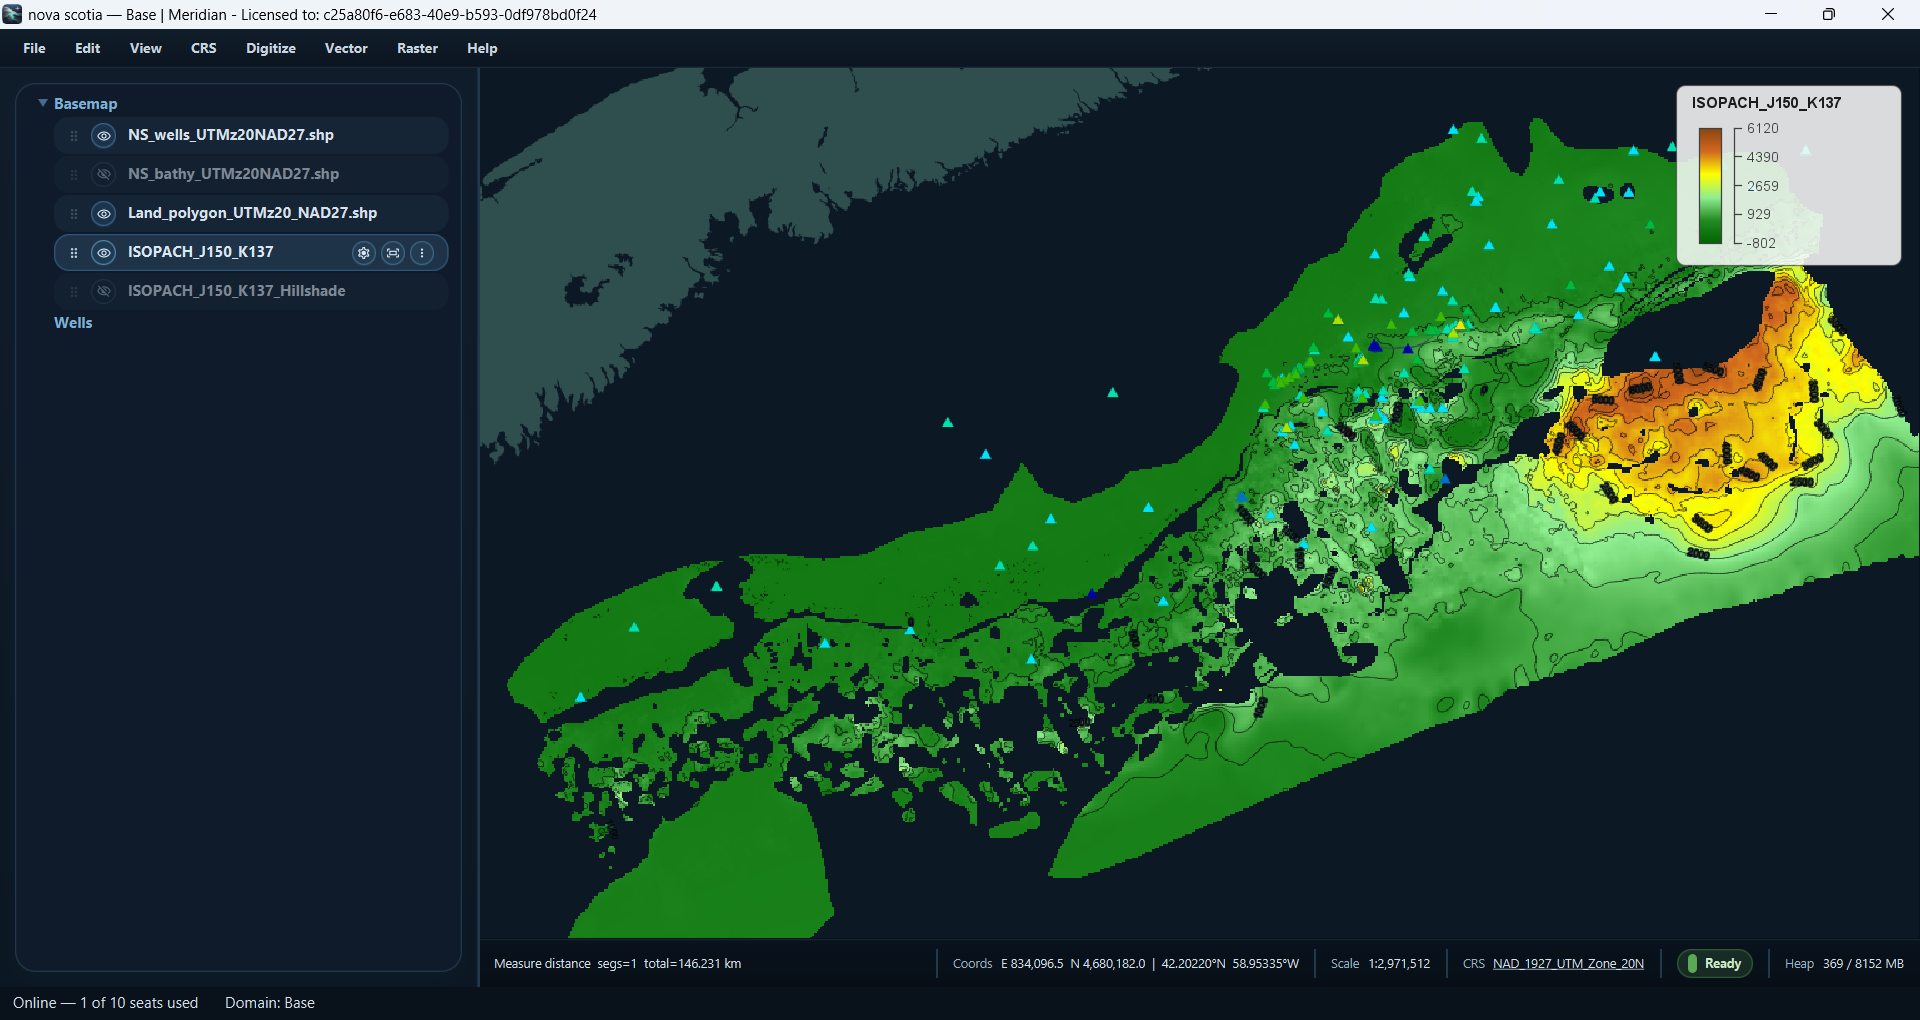
Drop a grid on the map and it renders with a sensible color ramp, contours, and a legend — no fiddling required. Hillshade, transparency, and ramp choices are a click away.

Layers stack the way you think about them: wells over grids over basemaps, reordered by drag, toggled at will.

A color-mapped isopach grid with contour lines and a floating legend in Meridian GIS
Isopach grid contours · hillshade · legend
02 Identify

Click anything. Get answers.

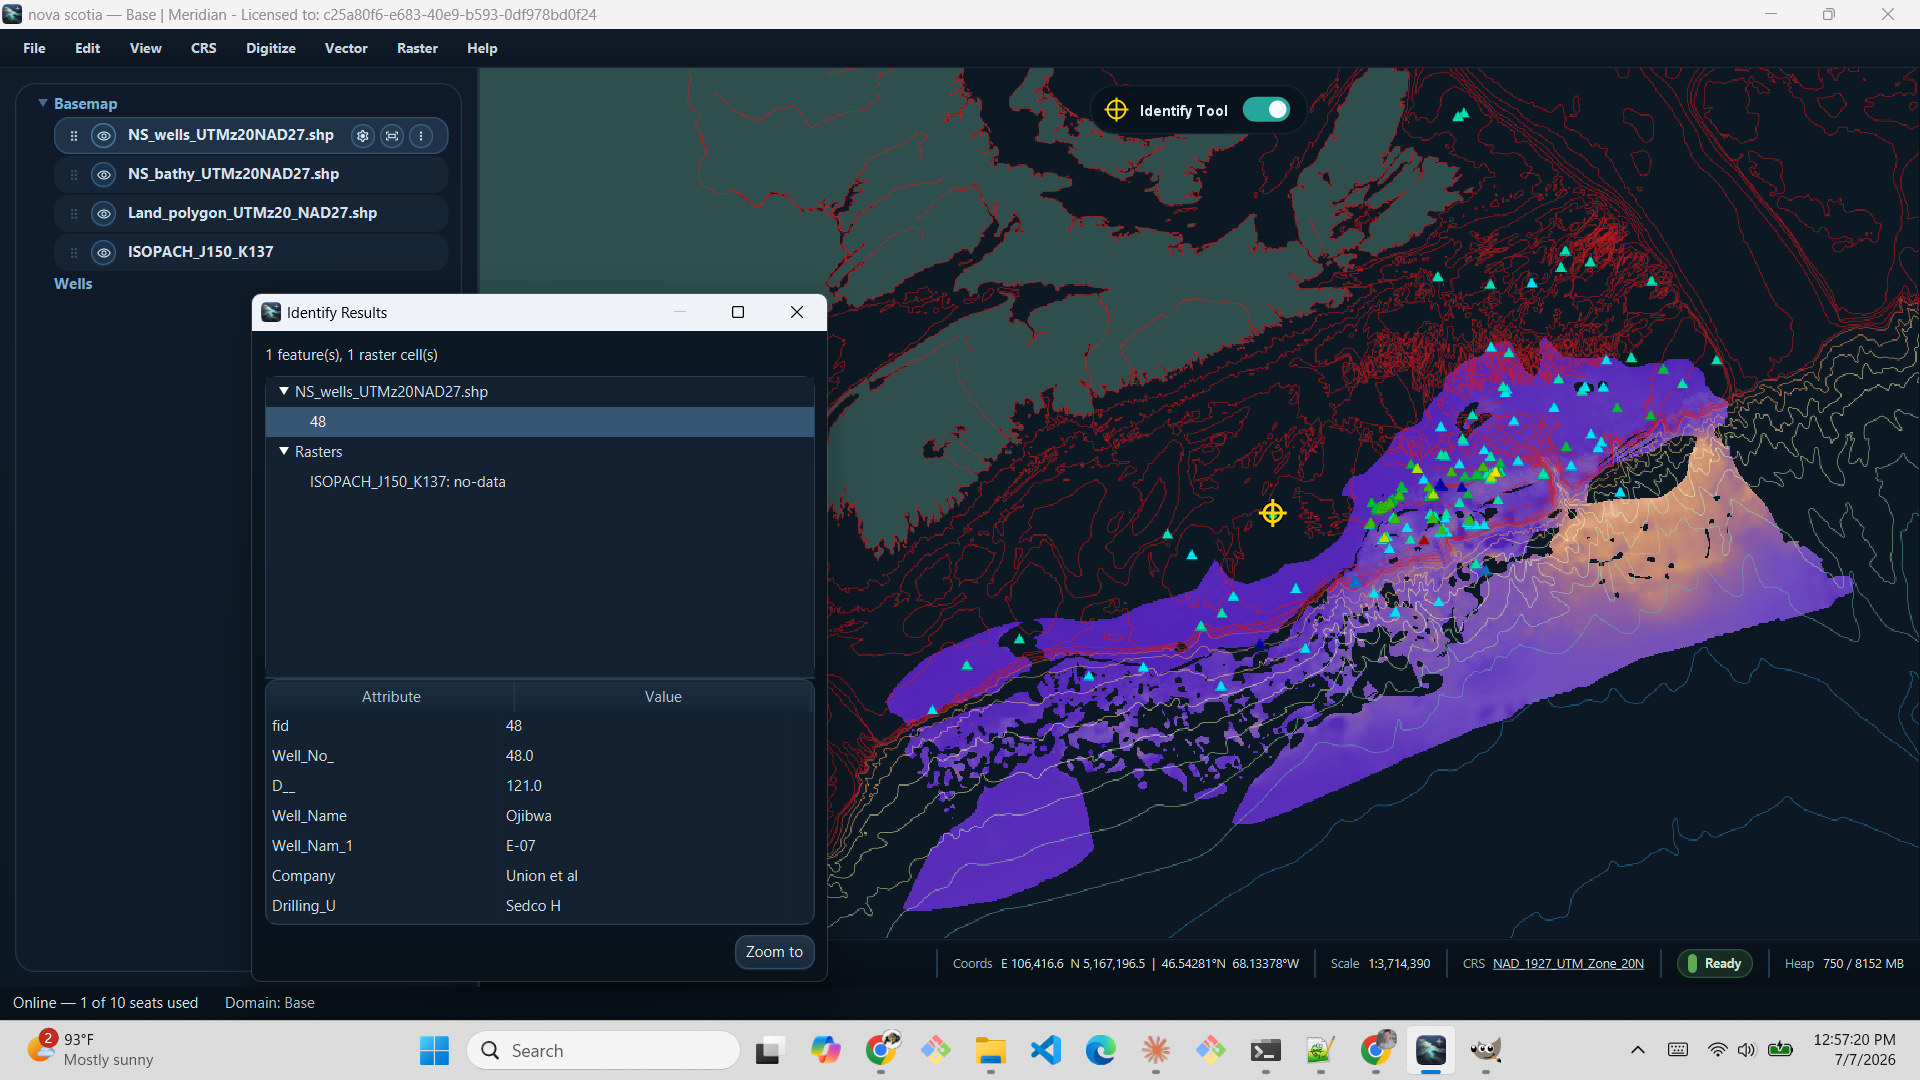
The Identify tool reads through every visible layer at the point you click — well attributes, grid values, feature properties — and lays them out in one place.

Found what you were looking for? Zoom to it and keep moving.

Identify Results dialog in Meridian GIS showing well attributes and raster values for a clicked map location
Identify tool features · raster cells · attributes
03 Measure

Distance and area, in the units you work in.

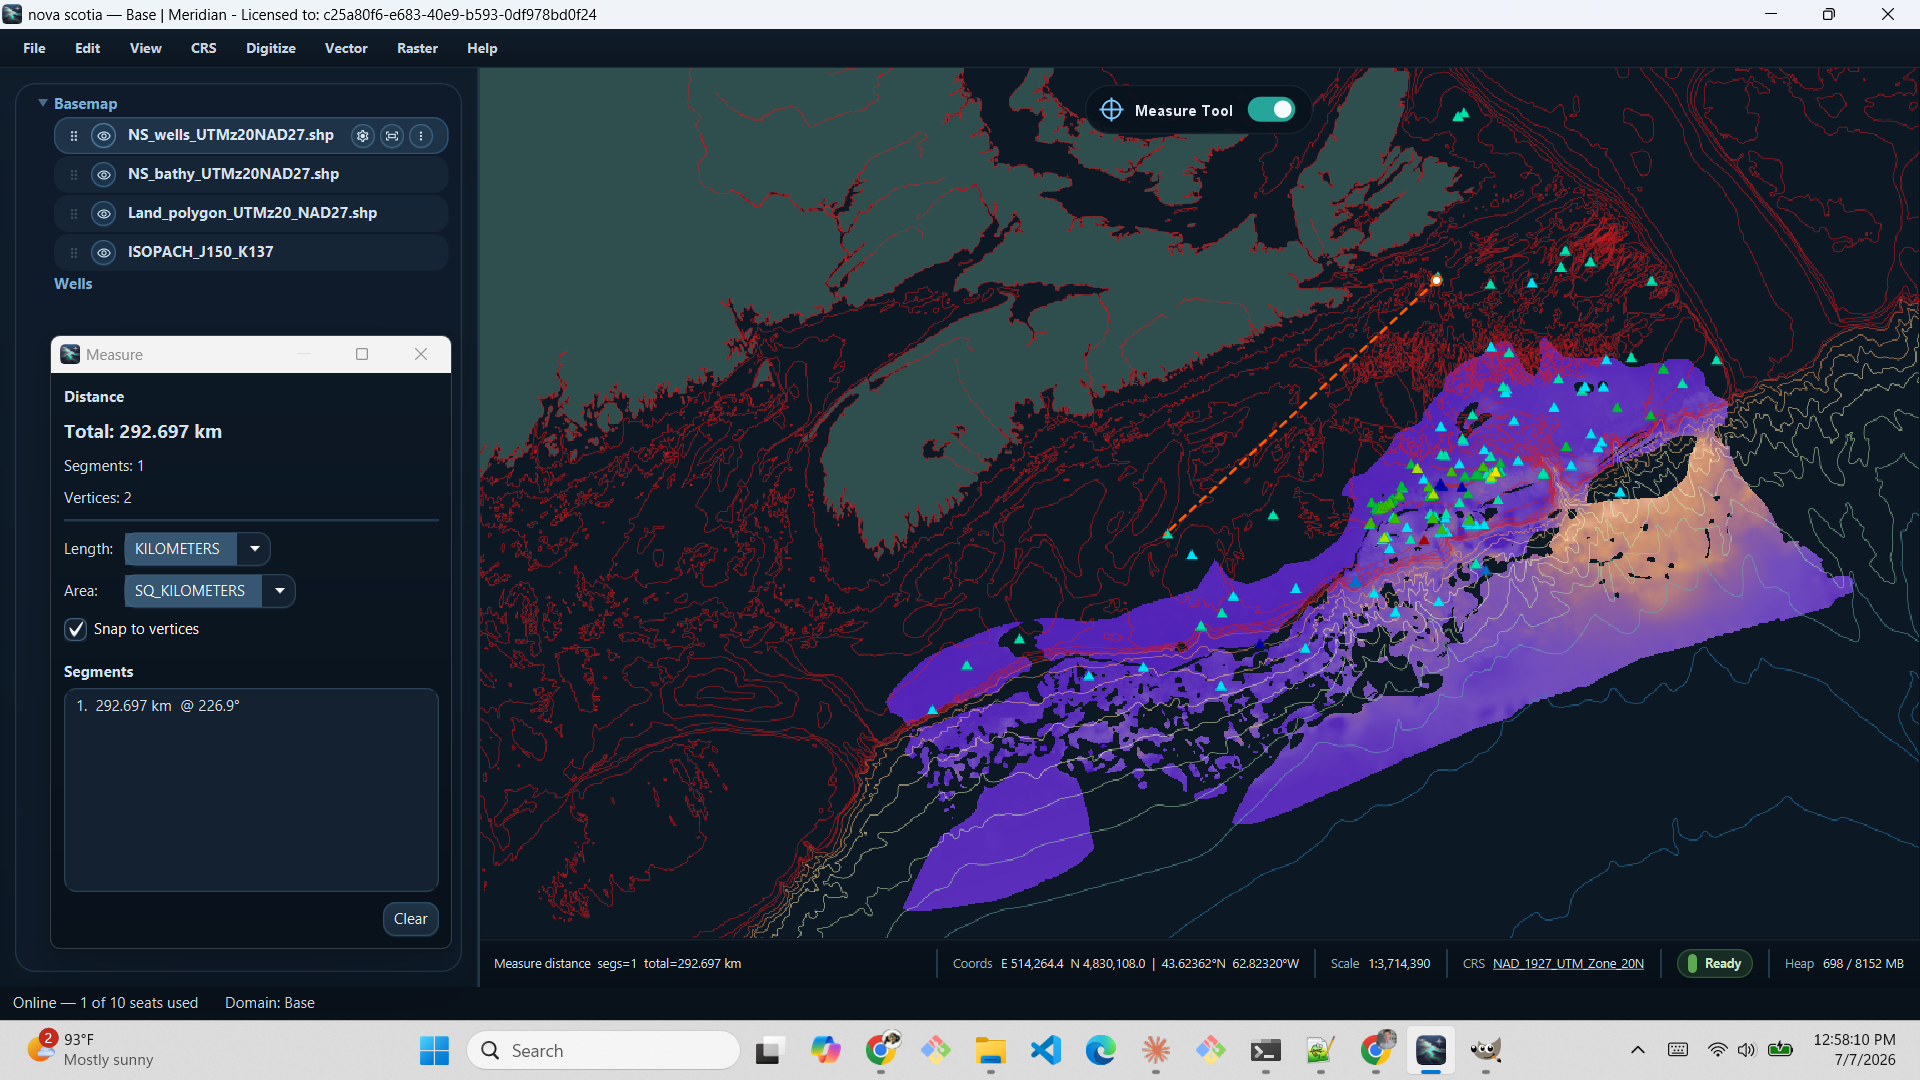
Click out a path or a polygon and read off distance, bearing, and area as you go. Snap to vertices when precision matters; switch units without re-measuring.

Measure tool in Meridian GIS showing a distance measurement across an offshore basin with segment bearing and length
Measure tool distance · bearing · area
04 Coordinate Systems

Mixed datums and legacy projections? Handled.

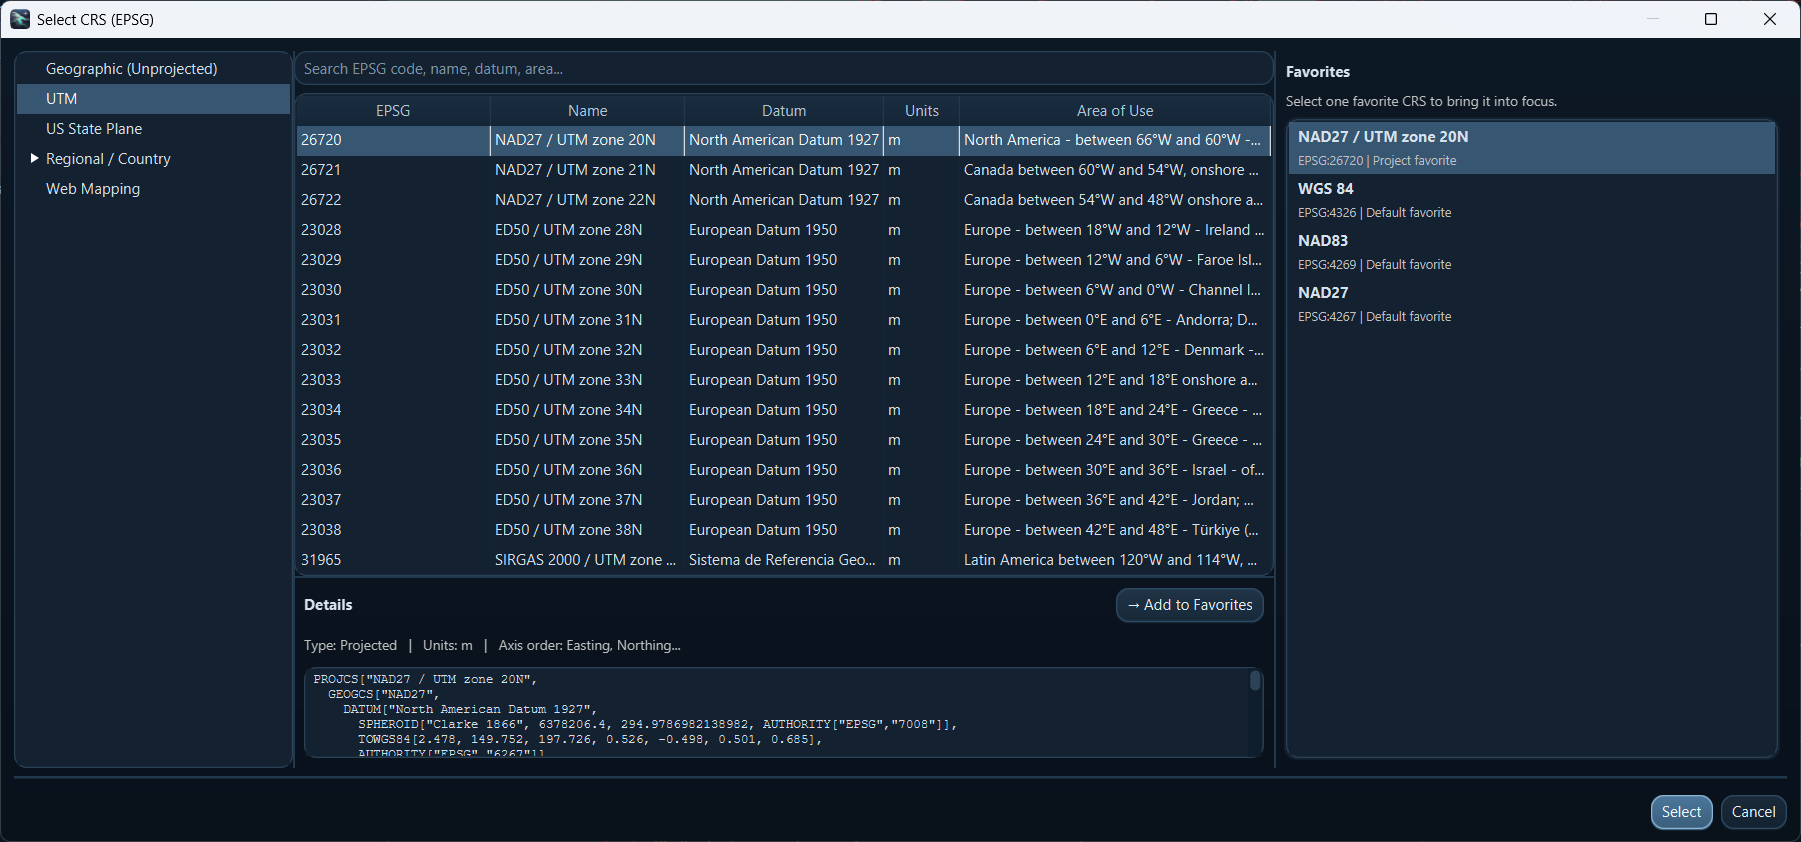
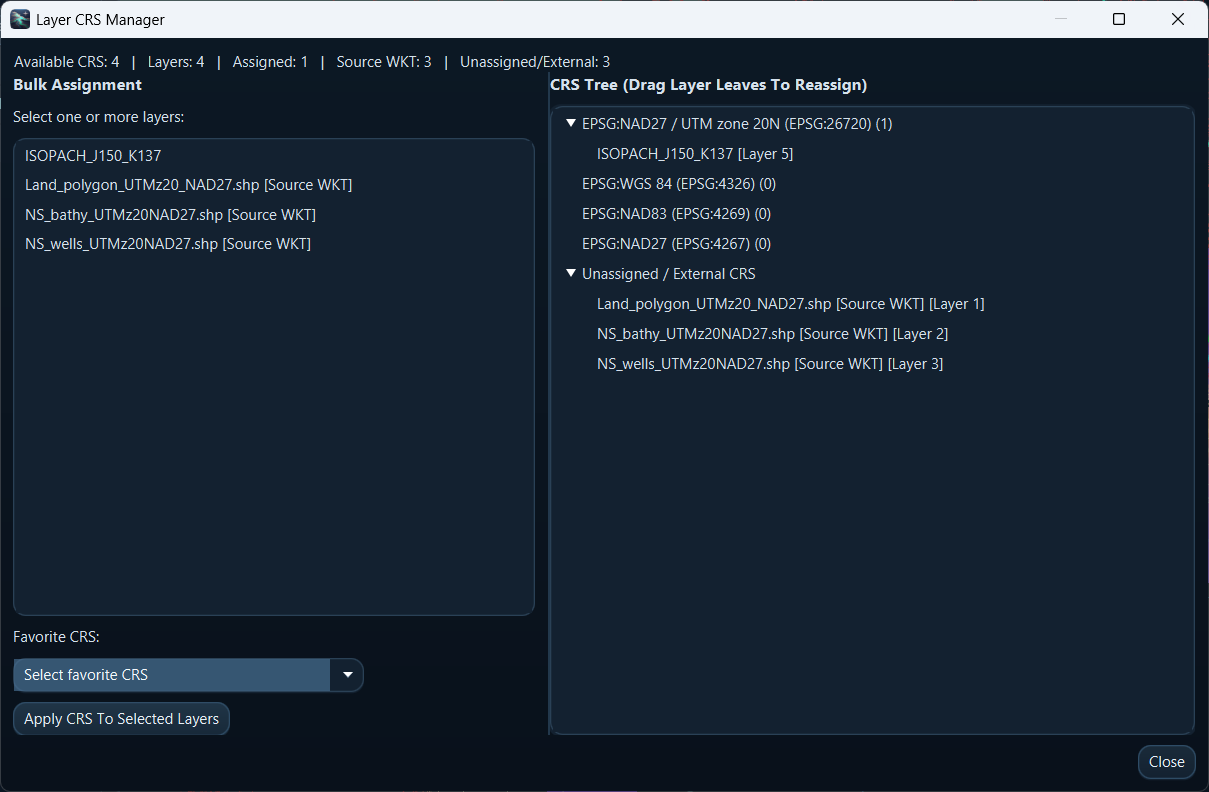
Real projects arrive in a mix of coordinate systems — NAD27 shapefiles from one vintage, WGS 84 exports from another. Meridian keeps a full EPSG library with search and favorites, tracks the CRS of every layer, and reprojects on the fly so everything lines up on the map.

Meridian's CRS selection dialog with a searchable EPSG library, WKT details, and a favorites list
CRS library searchable EPSG · favorites · WKT details
Layer CRS Manager in Meridian GIS showing layers grouped by coordinate system with drag-to-reassign
Layer CRS manager per-layer assignment
05 Why Meridian

Built on a few stubborn principles.

Native & offline

A real desktop application for Windows, macOS, and Linux. Your data never leaves your machine, and the whole project lives in a single file you can copy, archive, or share.

Non-destructive

Analysis operations always produce new layers — your source data is never modified. Every derived grid remembers where it came from and how it was made.

Built for geoscience

Reads the formats geoscientists actually have — from modern GeoTIFFs to legacy gridding packages — and grows with optional domain modules for petroleum, geothermal, and carbon capture.

06 Get Started

A GIS that respects your data and your machine.

Meridian GIS is a standalone product with optional domain modules. Start with the base. Add domains when you need them.

Download Meridian View documentation
Windows · macOS · Linux · Java runtime bundled